查看CPU使用率
Linux CPU使用率主要是从以下几个维度进行统计:
- %usr:普通进程在用户模下下执行的时间;
- %sys:进程在内核模式下的执行时间;
- %nice:被提高优先级的进程在用户模式下的执行时间;
- %idle:空闲时间。
- %iowait:等待I/O完成的时间。
- %hi(hardware interrupt):处理硬中断请求花费的时间。 %si(software interrupt):处理软中断请求花费的时间。 %steal:是衡量虚拟机CPU的指标,是指分配给本虚拟机的时间片被同一宿主机别的虚拟机占用,一般%steal值较高时,说明宿主机的资源使用已达到瓶颈;
最常用的是使用top查看主机CPU使用率概况:
# top
top - 21:00:50 up 7 days,  9:39,  1 user,  load average: 27.61, 30.33, 31.81
Tasks: 634 total,   1 running, 633 sleeping,   0 stopped,   0 zombie
%Cpu(s):  1.9 us,  1.8 sy,  0.0 ni, 96.3 id,  0.0 wa,  0.0 hi,  0.0 si,  0.0 st
KiB Mem : 26359844+total, 11326578+free, 13790921+used, 12423452 buff/cache
KiB Swap:        0 total,        0 free,        0 used. 12215860+avail Mem

    PID USER      PR  NI    VIRT    RES    SHR S  %CPU %MEM     TIME+ COMMAND
1679669 root      20   0  0.130t 0.125t  28760 S  3159 51.0  17273:47 qemu-system-x86
2633358 root      20   0   39636   3836   2748 R  11.8  0.0   0:00.04 top
     53 root      20   0       0      0      0 S   5.9  0.0   0:06.63 ksoftirqd/7
     59 root      20   0       0      0      0 S   5.9  0.0   0:06.52 ksoftirqd/8
   2246 tiger     20   0  522196  47508   6004 S   5.9  0.0   9:58.51 pingmeshagent
2110463 root      20   0       0      0      0 S   5.9  0.0   2:19.22 kworker/36:2
      1 root      20   0   72464   8612   6208 S   0.0  0.0   0:09.29 systemd
      2 root      20   0       0      0      0 S   0.0  0.0   0:00.26 kthreadd
...
如果想查看一个进程中不同线程的cpu占用,可以用top -H
# top -p 1679669 -H
top - 20:57:14 up 7 days,  9:35,  1 user,  load average: 34.10, 33.52, 32.95
Threads:  61 total,  33 running,  28 sleeping,   0 stopped,   0 zombie
%Cpu(s):  1.9 us,  1.8 sy,  0.0 ni, 96.3 id,  0.0 wa,  0.0 hi,  0.0 si,  0.0 st
KiB Mem : 26359844+total, 11327647+free, 13789968+used, 12422300 buff/cache
KiB Swap:        0 total,        0 free,        0 used. 12216726+avail Mem

    PID USER      PR  NI    VIRT    RES    SHR S %CPU %MEM     TIME+ COMMAND
1679719 root      20   0  0.130t 0.125t  28760 R 99.9 51.0 673:16.85 CPU 2/KVM
1679723 root      20   0  0.130t 0.125t  28760 R 99.9 51.0 684:26.35 CPU 5/KVM
1679724 root      20   0  0.130t 0.125t  28760 R 99.9 51.0 686:22.61 CPU 6/KVM
1679716 root      20   0  0.130t 0.125t  28760 R 93.8 51.0 648:27.52 CPU 0/KVM
1679718 root      20   0  0.130t 0.125t  28760 R 93.8 51.0 663:47.31 CPU 1/KVM
1679720 root      20   0  0.130t 0.125t  28760 R 93.8 51.0 682:32.19 CPU 3/KVM
...
如果需要查看不同核心上的CPU占用情况,在top中,按1查看:
top - 21:03:54 up 7 days,  9:42,  1 user,  load average: 29.36, 28.93, 30.93
Tasks: 636 total,   1 running, 634 sleeping,   0 stopped,   1 zombie
%Cpu0  :  0.3 us,  1.0 sy,  0.0 ni, 98.6 id,  0.0 wa,  0.0 hi,  0.0 si,  0.0 st
%Cpu1  :  0.7 us,  0.3 sy,  0.0 ni, 98.7 id,  0.0 wa,  0.0 hi,  0.3 si,  0.0 st
%Cpu2  :  1.7 us,  1.3 sy,  0.0 ni, 97.0 id,  0.0 wa,  0.0 hi,  0.0 si,  0.0 st
%Cpu3  :  1.0 us,  0.0 sy,  0.0 ni, 99.0 id,  0.0 wa,  0.0 hi,  0.0 si,  0.0 st
%Cpu4  :  2.6 us,  4.0 sy,  0.0 ni, 93.4 id,  0.0 wa,  0.0 hi,  0.0 si,  0.0 st
%Cpu5  :  0.3 us,  0.3 sy,  0.0 ni, 99.3 id,  0.0 wa,  0.0 hi,  0.0 si,  0.0 st
%Cpu6  : 41.2 us, 45.5 sy,  0.0 ni, 13.3 id,  0.0 wa,  0.0 hi,  0.0 si,  0.0 st
%Cpu7  : 37.8 us, 46.2 sy,  0.0 ni, 16.1 id,  0.0 wa,  0.0 hi,  0.0 si,  0.0 st
%Cpu8  : 66.0 us, 31.0 sy,  0.0 ni,  3.0 id,  0.0 wa,  0.0 hi,  0.0 si,  0.0 st
%Cpu9  : 39.6 us, 45.6 sy,  0.0 ni, 14.8 id,  0.0 wa,  0.0 hi,  0.0 si,  0.0 st
...
也可以使用mpstat查看各CPU核心上占用情况:
# mpstat -P ALL
Linux 4.9.0-8-amd64 (n19-044-051) 	01/15/2019 	_x86_64_	(48 CPU)

09:13:40 PM  CPU    %usr   %nice    %sys %iowait    %irq   %soft  %steal  %guest  %gnice   %idle
09:13:40 PM  all    0.17    0.00    1.83    0.02    0.00    0.00    0.00    1.74    0.00   96.24
09:13:40 PM    0    0.26    0.00    0.41    0.10    0.00    0.00    0.00    0.00    0.00   99.22
09:13:40 PM    1    0.29    0.00    1.09    0.06    0.00    0.01    0.00    0.00    0.00   98.56
09:13:40 PM    2    0.57    0.00    0.20    0.01    0.00    0.01    0.00    0.00    0.00   99.21
09:13:40 PM    3    0.25    0.00    0.13    0.01    0.00    0.00    0.00    0.00    0.00   99.61
09:13:40 PM    4    0.17    0.00    0.11    0.01    0.00    0.00    0.00    0.00    0.00   99.71
09:13:40 PM    5    0.19    0.00    0.11    0.01    0.00    0.00    0.00    0.00    0.00   99.69
...
如果需要观察指定进程的CPU占用详情,可以使用pidstat:
# pidstat 3
Linux 4.14.81.bm.7-amd64 (n19-103-026) 	01/16/2019 	_x86_64_	(36 CPU)

12:27:14 AM   UID       PID    %usr %system  %guest    %CPU   CPU  Command
12:27:17 AM     0        23    0.00    0.33    0.00    0.33     2  ksoftirqd/2
12:27:17 AM     0        29    0.00    0.33    0.00    0.33     3  ksoftirqd/3
12:27:17 AM     0        35    0.00    0.33    0.00    0.33     4  ksoftirqd/4
12:27:17 AM     0        47    0.00    0.33    0.00    0.33     6  ksoftirqd/6
12:27:17 AM     0        53    0.00    0.33    0.00    0.33     7  ksoftirqd/7
12:27:17 AM     0       283    0.00    0.33    0.00    0.33    26  kworker/26:1
12:27:17 AM   103       985    0.00    0.33    0.00    0.33    11  nscd
12:27:17 AM  2000      1445    0.33    0.00    0.00    0.33    27  falcon-agent
...
CPU使用率 ≠ CPU执行效率
可能你认为的 90% CPU 利用率意味着这样的情形:

而实际却可能是这样的:

CPU 并非 90% 的时间都在忙着,很大一部分时间在等待,或者说“停顿(Stalled)”了。这种情况表示处理器流水线停顿,一般由资源竞争、数据依赖等原因造成。多数情况下表现为等待访存操作,其中又以读操作为主。在停顿周期内,不能执行指令,这意味着你的程序不往前走。值得注意的是,图中 “Stalled” 状态所占的比例是作者依据生产环境中的典型场景计算而来,具有普遍现实意义。因此,大多时候 CPU 处于停顿状态,而你却不知道,因为 CPU 利用率这个指标没有告诉你真相。通过进一步分析 CPU 停顿的原因,可以指导代码优化,提高执行效率,这是我们深入理解CPU微架构的动力之一。
我们通常所说的CPU利用率是指 “non-idle time”:即CPU不执行 idle thread 的时间。操作系统内核会在上下文切换时记录CPU的运行时间。假设一个 non-idle thread 开始运行,100ms 后结束,内核会认为这段时间内 CPU 利用率为 100%。
那么这个所谓“利用率”的问题在哪儿呢?
CPU的流水线执行效率
- Cache Miss
- 分支预测失败
- Cache伪共享(False Sharing)
以上这些因素都会导致CPU执行效率剧烈下降,比如下面的membound.c, 故意在每次内存访问的时候都调用clflush()清空缓存,导致大量cache miss, 因此我们可以观察到虽然下面membound的CPU使用率虽然是100%, 但是实际执行效率(IPC)却非常低。
// membound.c
#include <stdlib.h>
#include <emmintrin.h>
#include <stdio.h>
#include <signal.h>

char a = 1;

void memory_bound() {
    register unsigned i=0;
    register char b;

    for (i=0;i<(1u<<24);i++) {
        // evict cacheline containing a
         _mm_clflush(&a);
         b = a;
    }
}

int main() {
    memory_bound();
    return 0;
}
# perf stat -a -- ./membound

 Performance counter stats for 'system wide':

      78398.511034      cpu-clock (msec)          #   47.964 CPUs utilized
             8,896      context-switches          #    0.113 K/sec
               353      cpu-migrations            #    0.005 K/sec
            44,443      page-faults               #    0.567 K/sec
     5,584,331,424      cycles                    #    0.071 GHz
     1,128,939,361      instructions              #    0.20  insn per cycle
       221,178,441      branches                  #    2.821 M/sec
         4,050,623      branch-misses             #    1.83% of all branches

       1.634531147 seconds time elapsed
性能工具中使用 %CPU 时都应该附带上 IPC,或者将 %CPU 拆分为指令执行消耗 cycle(%INS) 和 stalled 的 cycle(%STL)。对应到 top,在 Linux 系统有一个能够显示每个处理器 IPC 的工具 tiptop:
# tiptop -c --cpu-min 0

09:13:11 PM   17    0.04    0.00    0.06    0.00    0.00    0.00    0.00    0.01    0.00   99.89
tiptop -                                                                                                               [root]
Tasks: 131 total,  35 displayed                                                                                                                            screen  0: default

  PID [ %CPU] %SYS    P   Mcycle   Minstr   IPC  %MISS  %BMIS  %BUS COMMAND
 2044+   0.0   0.0   25    20.80    15.63  0.75   0.53   0.42   0.0 /opt/open-falcon/agent/falcon-agent -c /opt/open-falcon/agent/cfg.json
 1681    0.0   0.0   32     0.09     0.02  0.18   3.07   2.49   0.1 nginx: worker process
 1687    0.0   0.0   28     0.08     0.02  0.21   2.64   1.82   0.0 nginx: worker process
 ...
 2113+   0.0   0.0   24     0.76     0.12  0.16   7.90   1.15   0.1 /usr/bin/redis-server 127.0.0.1:6379
 1674    0.0   0.0   24     0.09     0.02  0.18   2.95   2.28   0.1 nginx: worker process
 1655    0.0   0.0   43     0.07     0.02  0.25   4.08   2.31   0.0 nginx: worker process
 1703    0.0   0.0    9     0.04     0.02  0.38   1.91   0.52   0.0 nginx: worker process
 ...
Spinlock自旋锁
CPU 一直在被使用,同时 IPC 也很高,但是应用逻辑上并没有任何进展,比如最近我们在冷存储服务器混部虚拟机的时候,有时候主机的sys占用特别高,On-CPU火焰图发现CPU主要消耗在thp_poage_fault()导致的Spinlock中:
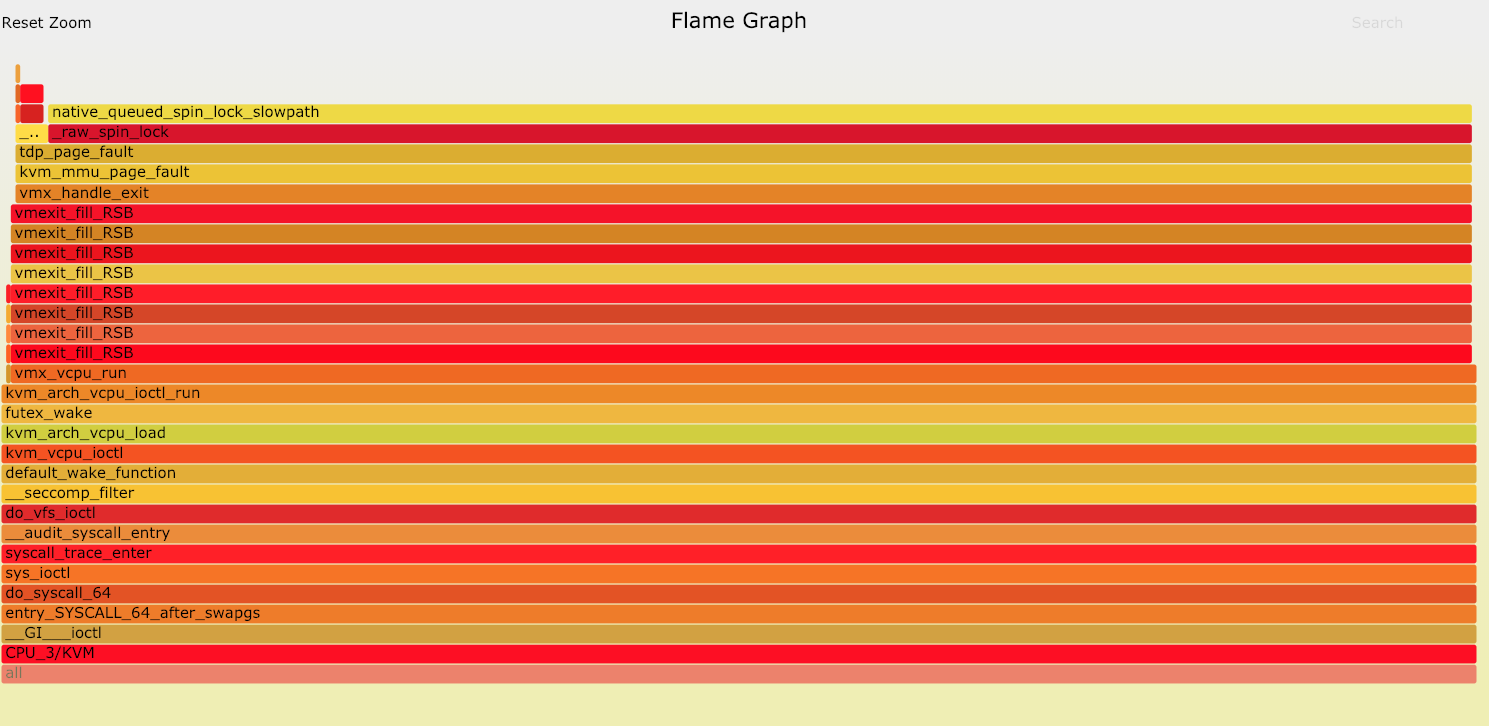
经过分析主要是由于冷存储主机的free内存量很低,导致内核频繁触发kswapd和kcompactd尝试回写和合并高阶内存,导致虚拟机由于ept violation退出,然后各个vcpu进程争抢spinlock处理page faults。后虚拟机采用hugetlbfs解决了该问题。
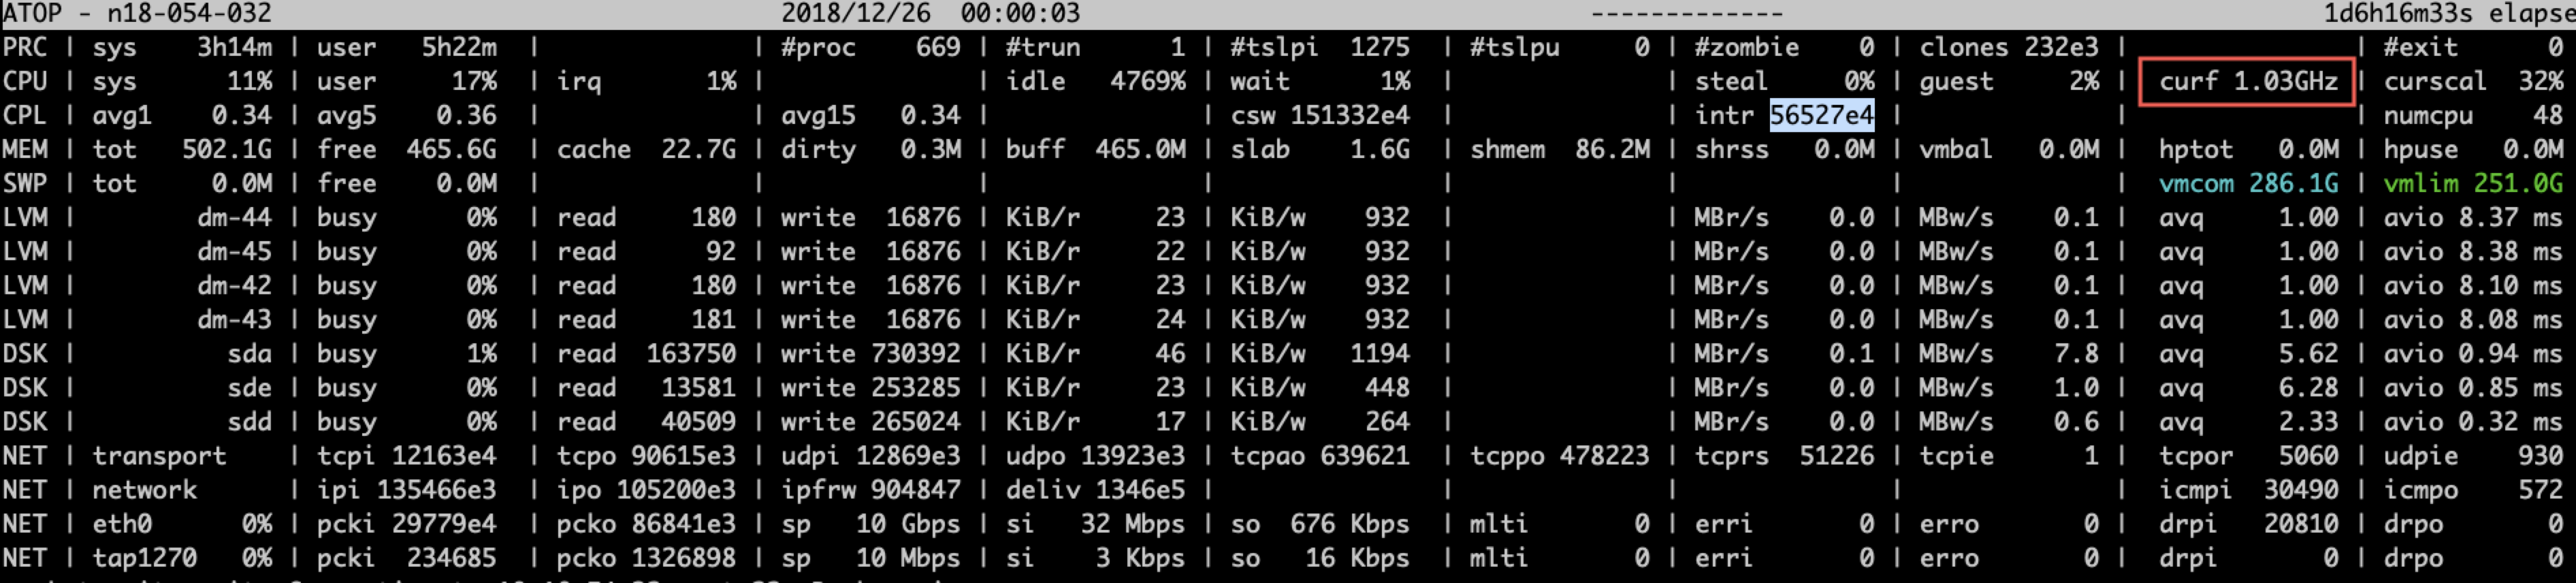
CPU降频率
由于C-State,powersaving,服务器故障等因素会导致CPU降频,使用atop可以观察当前cpu的实际运行频率。比如当CPU使用率较高,而CPU又运行在较低频率上的时候,CPU的实际执行效率是很低的。
MCE故障
Machine Check Exception (MCE) 是CPU发现硬件错误时触发的异常(exception),中断号是18,导致MCE的原因主要有:总线故障、内存ECC校验错、cache错误、TLB错误、内部时钟错误,等等。不仅硬件故障会引起MCE,不恰当的BIOS配置、firmware bug、软件bug也有可能引起MCE。
从/var/log/message日志发现,CPU 12读取内存的时候不停出现错误,虽然这些错误可以被纠正,但是造成sys开销异常冲高:
...
mcelog: Fallback Socket memory error count 125 exceeded threshold: 97388822 in 24h
mcelog: Location SOCKET:1 CHANNEL:? DIMM:? []
kernel: [646154.991833] mce: [Hardware Error]: Machine check events logged
kernel: [646154.991882] EDAC MC2: 73 CE memory read error on CPU_SrcID#1_MC#0_Chan#1_DIMM#1 (channel:1 slot:1 page:0x2b4882a offset:0x2c0 grain:32 syndrome:0x0 -  OVERFLOW err_code:0101:0091 socket:1 imc:0 rank:0 bg:1 ba:0 row:a919 col:88)
kernel: [646154.991909] EDAC MC3: 1 CE memory read error on CPU_SrcID#1_MC#1_Chan#1_DIMM#1 (channel:1 slot:1 page:0x2eff96b offset:0xf00 grain:32 syndrome:0x0 -  err_code:0101:0091 socket:1 imc:1 rank:0 bg:2 ba:0 row:efeb col:f0)
...
CPU 利用率已经开始成为一个容易误导的指标:它包含访存导致的等待周期,这样会影响一些新应用。也许 “%CPU” 应该重命名为 “%CYC”(cycles的缩写)。要清楚知道 “%CPU” 的含义,需要使用其他指标进行辅助, 比如:
IPC: perf, tiptop…SYS负载: perf,On-CPU火焰图…主机亚健康: MCE, THR, 降频…